Guesty's Open API is a REST API offers a versatile solution for integrating your own systems with your Guesty account. It uses OAuth 2.0 access tokens to authenticate requests, ensuring secure and reliable authorization. OAuth 2.0 is a secure, industry-standard authorization method that ensures user data is accessed safely using encoded tokens without exposing the user’s identity or credentials. For more information, refer to our API documentation and details on Guesty’s API call rate limits.
Guesty's Open API allows you and your team to build and connect custom tools tailored to your needs. You can generate unique client IDs and client secrets (client credentials) for each service, tool, or system you integrate. Additionally, our analytics provide real time data on your API usage, helping you monitor and optimize your integrations.
Follow the instructions below to register a new application. You can delete it at any time.
Note:
You can create up to five (5) Open API OAuth applications.
Create API key pair
When you register an application, you will receive a client ID and a client secret, which can be used when making API calls that require application identification.
Step by step:
- Sign in to your Guesty account.
- In the side navigation menu, click
 Integrations to open the dropdown menu.
 - Select OAuth applications.
- At the top right, click New application.
- Enter the application name and description and click Save. These are mandatory fields.
-
Click
 next to the relevant key and paste it somewhere safe for future reference.
Important:
Your client ID and client secret are only visible the first time you access it, after which Guesty redacts it for your security.
Delete API key pair
To delete an application, along with its client ID and client secret, click ![]() to the right of the relevant application and confirm the action in the pop-up. This action is irreversible.
to the right of the relevant application and confirm the action in the pop-up. This action is irreversible.
Using Guesty's Open API analytics dashboard
Guesty's Open API analytics dashboard is designed to provide a detailed overview of your application's API usage and performance. This tool allows you to monitor key metrics such as request success rates, client errors, and rate limit thresholds. Each section of the dashboard offers valuable insights, helping you optimize API calls, troubleshoot issues, and ensure smooth integration with third-party applications.
Follow the instructions to access Guesty's Open API dashboard.
Step by step:
- Sign in to your Guesty account.
- In the side navigation menu, click Integrations to open the dropdown menu.
- Select OAuth analytics.
Using Guesty's client-facing webhooks
Guesty's webhooks section provides a centralized interface to manage webhooks, view activity, and troubleshoot issues effectively.
Note:
The webhooks dashboard doesn't currently support webhook subscription management. You can subscribe to and manage webhooks only via the Open API. To manage webhook subscriptions, refer to the webhooks API guide.
Endpoints
Regularly monitor endpoints to ensure low error rates and resolve any issues promptly. View and manage all active webhook URLs and their respective error rates.
View logs for a specific URL
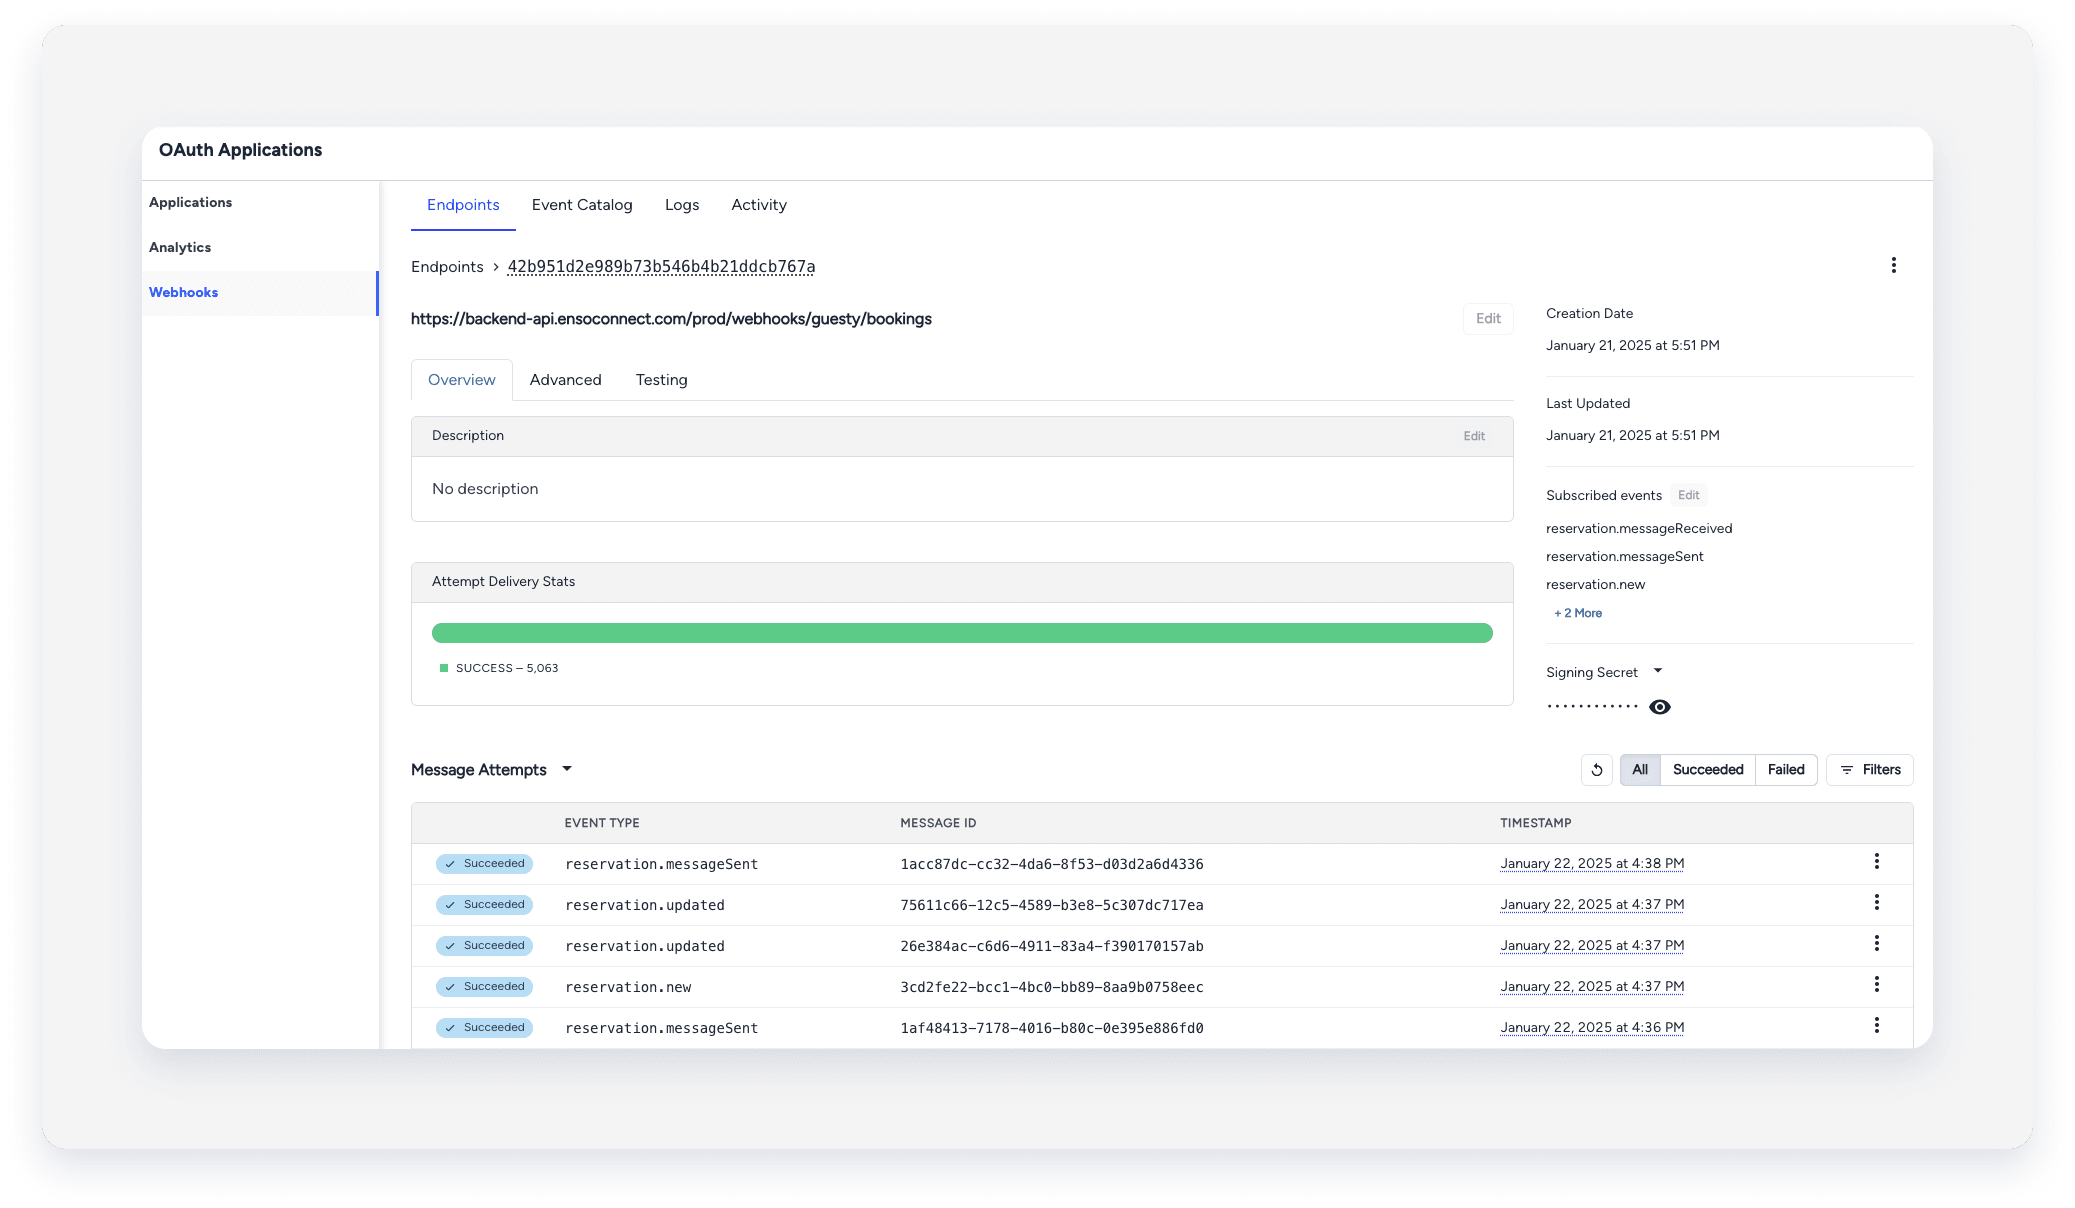
Click a webhook URL to access detailed information, which includes the Signing secret (the key used to authenticate requests from Guesty to your endpoint) and the ability to replay individual webhook events.